• For Individuals
  • For Businesses
  • For Universities
  • For Governments
Coursera
  • Online Degrees
  • Careers
  • Log In
  • Join for Free
    Coursera
    • Browse
    • Plot Grafiken
    Skip to search results

    Filter by

    Subject
    Required
     *

    Language
    Required
     *

    The language used throughout the course, in both instruction and assessments.

    Learning Product
    Required
     *

    Build job-relevant skills in under 2 hours with hands-on tutorials.
    Learn from top instructors with graded assignments, videos, and discussion forums.
    Learn a new tool or skill in an interactive, hands-on environment.
    Get in-depth knowledge of a subject by completing a series of courses and projects.
    Earn career credentials from industry leaders that demonstrate your expertise.

    Level
    Required
     *

    Duration
    Required
     *

    Skills
    Required
     *

    Subtitles
    Required
     *

    Educator
    Required
     *

    Results for "plot (grafiken)"

    • Status: Free Trial
      Free Trial
      A

      Arizona State University

      Random Models, Nested and Split-plot Designs

      Skills you'll gain: Statistical Analysis, Regression Analysis, Statistical Modeling, Statistical Methods, Data Transformation, Probability Distribution

      4.7
      Rating, 4.7 out of 5 stars
      ·
      35 reviews

      Intermediate · Course · 1 - 4 Weeks

    • P

      Packt

      How to Visualize Data with R

      Skills you'll gain: Data Visualization Software, Data Visualization, Ggplot2, Plot (Graphics), R Programming, Scatter Plots, Graphing, Data Analysis, Data Wrangling, Data Manipulation, Data Import/Export, Regression Analysis, Software Installation, Package and Software Management

      Intermediate · Course · 1 - 4 Weeks

    • Status: Free Trial
      Free Trial
      L

      LearnQuest

      Fundamentals of Machine Learning for Supply Chain

      Skills you'll gain: Exploratory Data Analysis, Data Wrangling, Operations Research, NumPy, Data Manipulation, Supply Chain, Data Transformation, Pandas (Python Package), Data Analysis, Data Cleansing, Data Science, Programming Principles, Python Programming, Applied Machine Learning, Plot (Graphics), Computer Programming, Data Structures

      3.8
      Rating, 3.8 out of 5 stars
      ·
      38 reviews

      Beginner · Course · 1 - 4 Weeks

    • C

      Coursera Project Network

      Simulation of Call Centre Operations Using R Simmer

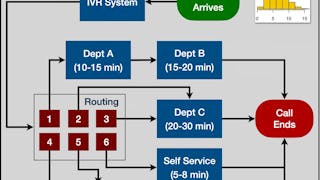
      Skills you'll gain: Simulations, Resource Management, Call Center Experience, Process Management, Workflow Management, Data Analysis, Process Analysis, Plot (Graphics), R Programming, Statistical Analysis, Statistical Modeling

      Beginner · Guided Project · Less Than 2 Hours

    • Status: New
      New
      Status: Preview
      Preview
      U

      University of Colorado Boulder

      Introduction to Python for Scientific Computing

      Skills you'll gain: Scientific Visualization, NumPy, Data Visualization, Debugging, Matplotlib, Numerical Analysis, Engineering Calculations, Integrated Development Environments, Computational Thinking, Engineering Analysis, Programming Principles, Jupyter, Data Analysis, Computer Programming

      Beginner · Course · 1 - 4 Weeks

    • Status: Preview
      Preview
      U

      University of Colorado Boulder

      Frozen in the Ice: Exploring the Arctic

      Skills you'll gain: Climate Change Programs, Environment, Systems Thinking, Cultural Sensitivity, Geographic Information Systems, Hydrology, Climate Change Adaptation, Environmental Monitoring, International Relations, Mathematical Modeling, Physical Science, Environmental Science, Biology, Scientific Methods, Physics, Research, Data Collection, Chemistry

      4.8
      Rating, 4.8 out of 5 stars
      ·
      18 reviews

      Beginner · Course · 1 - 3 Months

    • C

      Coursera Project Network

      Simulation of Covid-19 Testing Process Using R Simmer

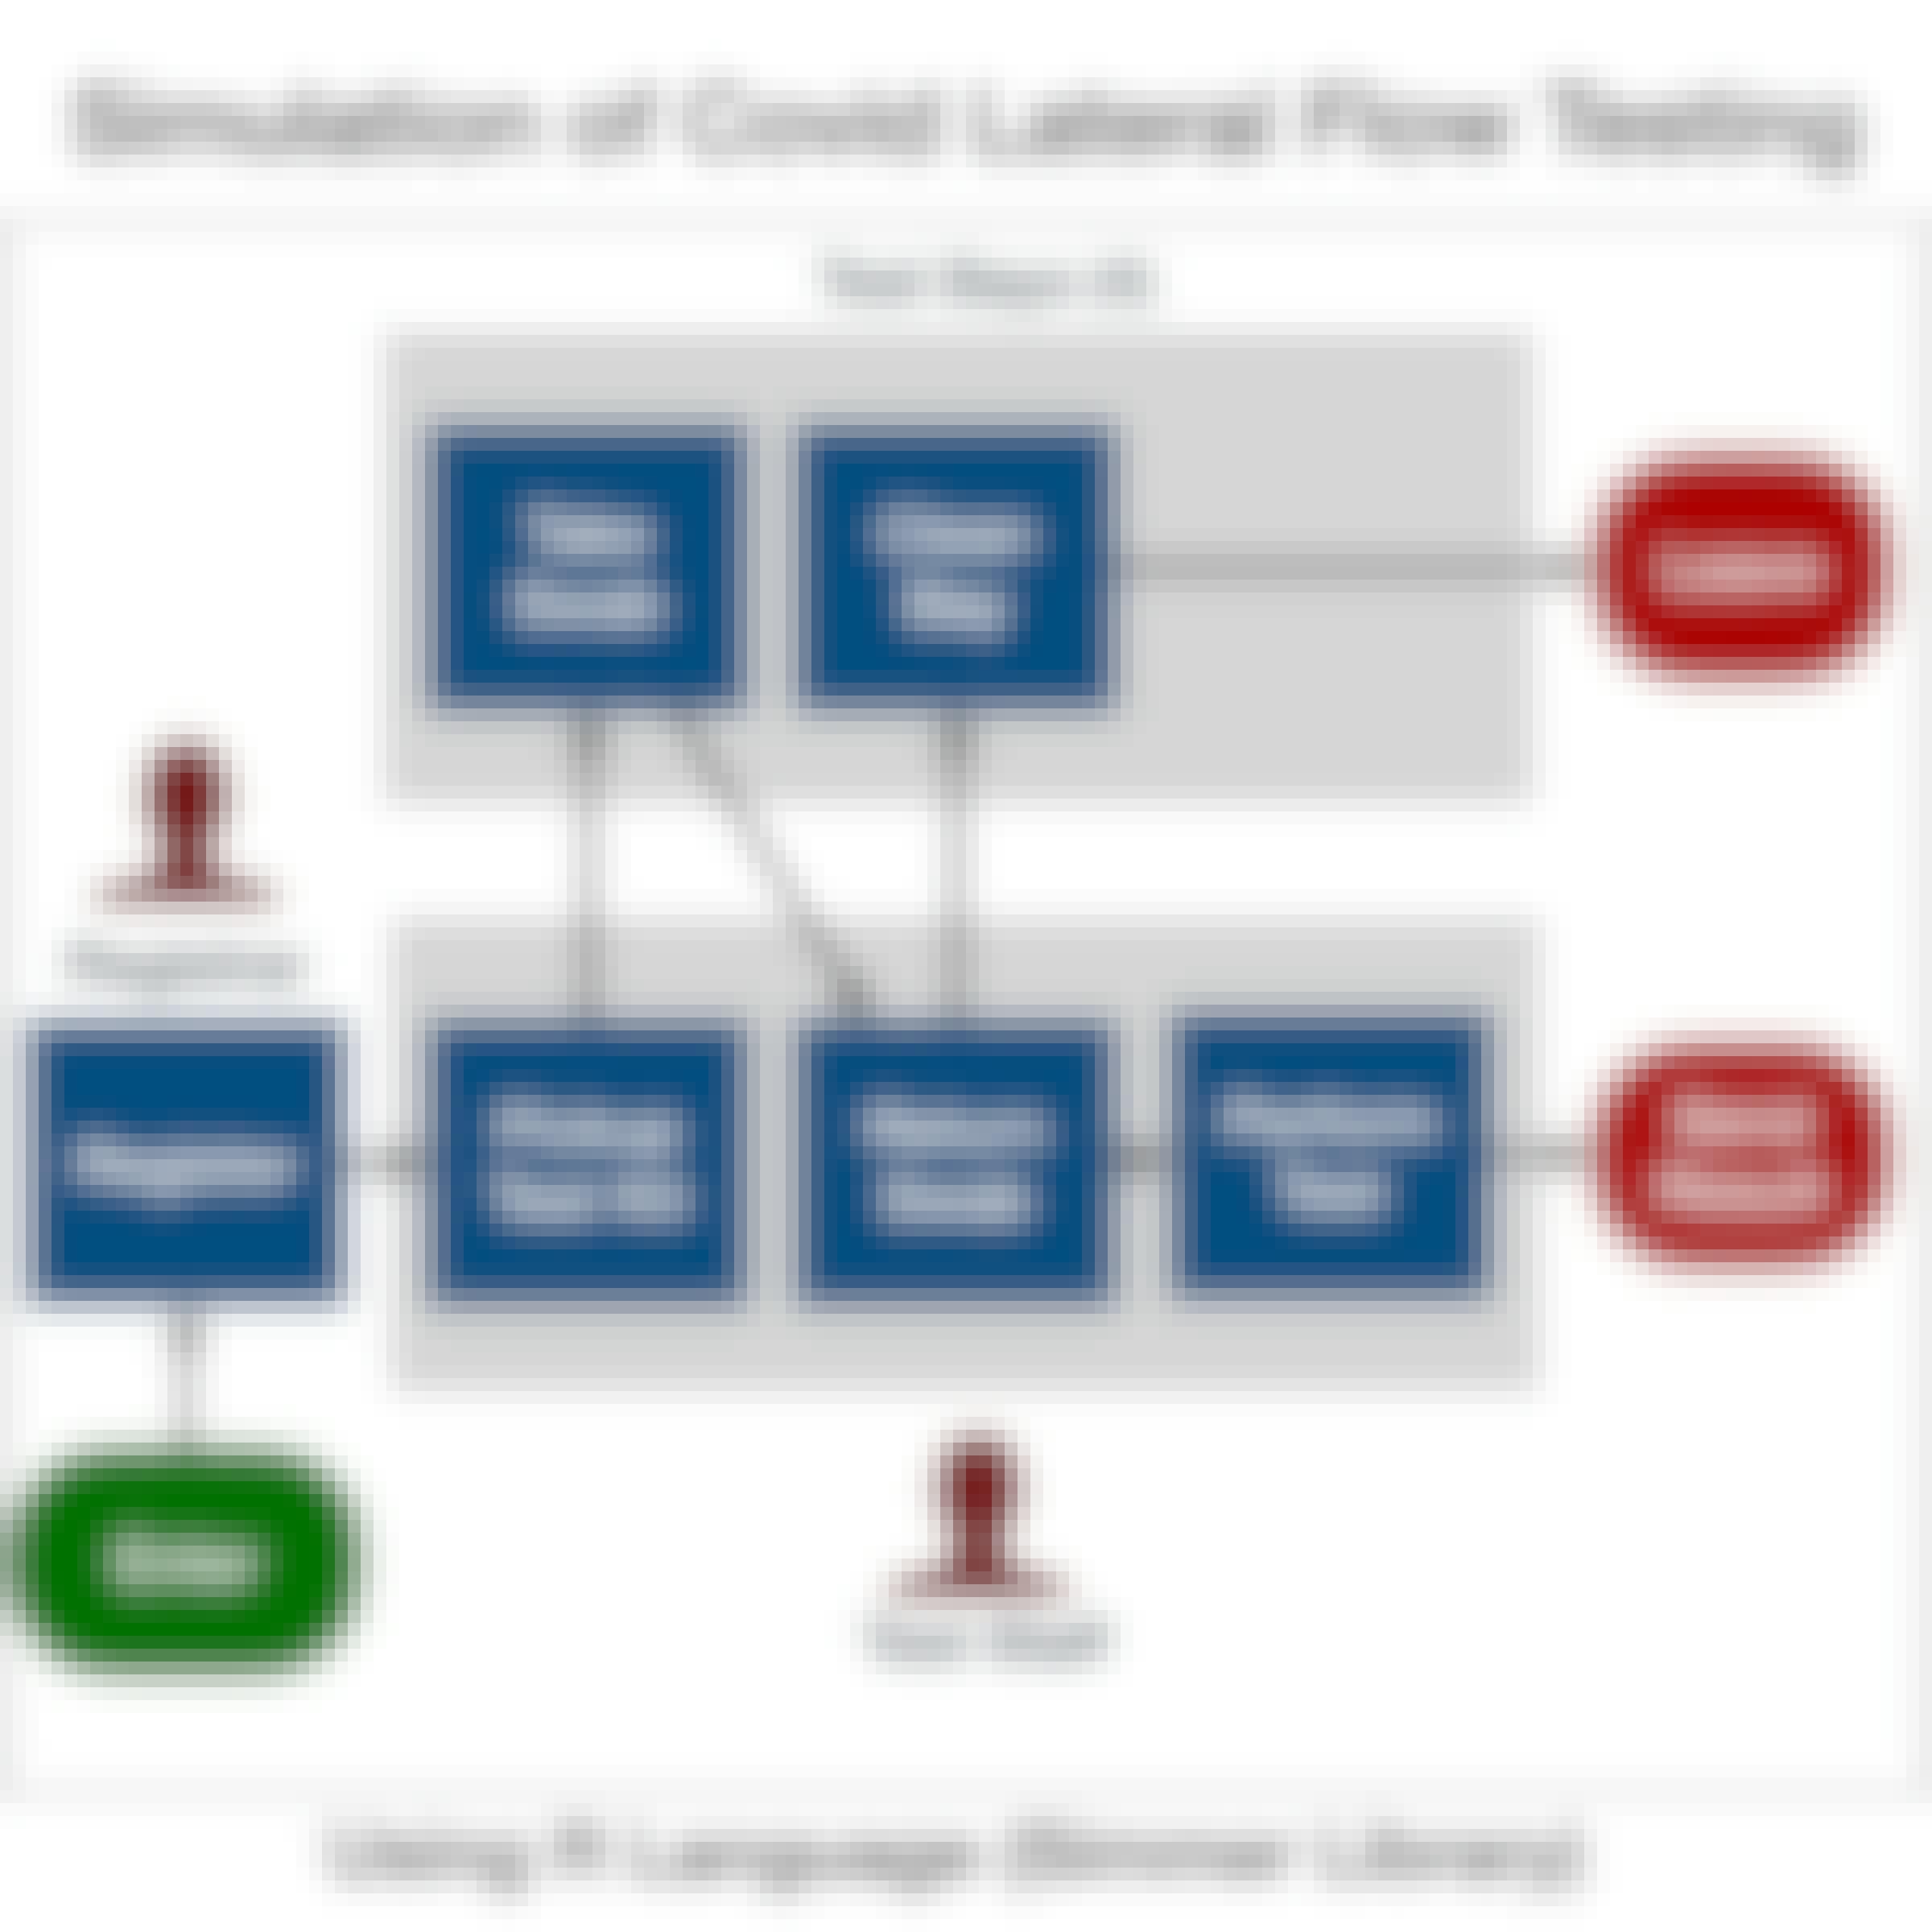
      Skills you'll gain: Simulations, Visualization (Computer Graphics), Statistical Visualization, R (Software), R Programming, Statistical Modeling, Statistical Programming, Statistical Analysis, Process Analysis, Data Analysis, Test Case

      5
      Rating, 5 out of 5 stars
      ·
      6 reviews

      Beginner · Guided Project · Less Than 2 Hours

    • C

      Coursera Project Network

      Conducting Exploratory Data Analysis

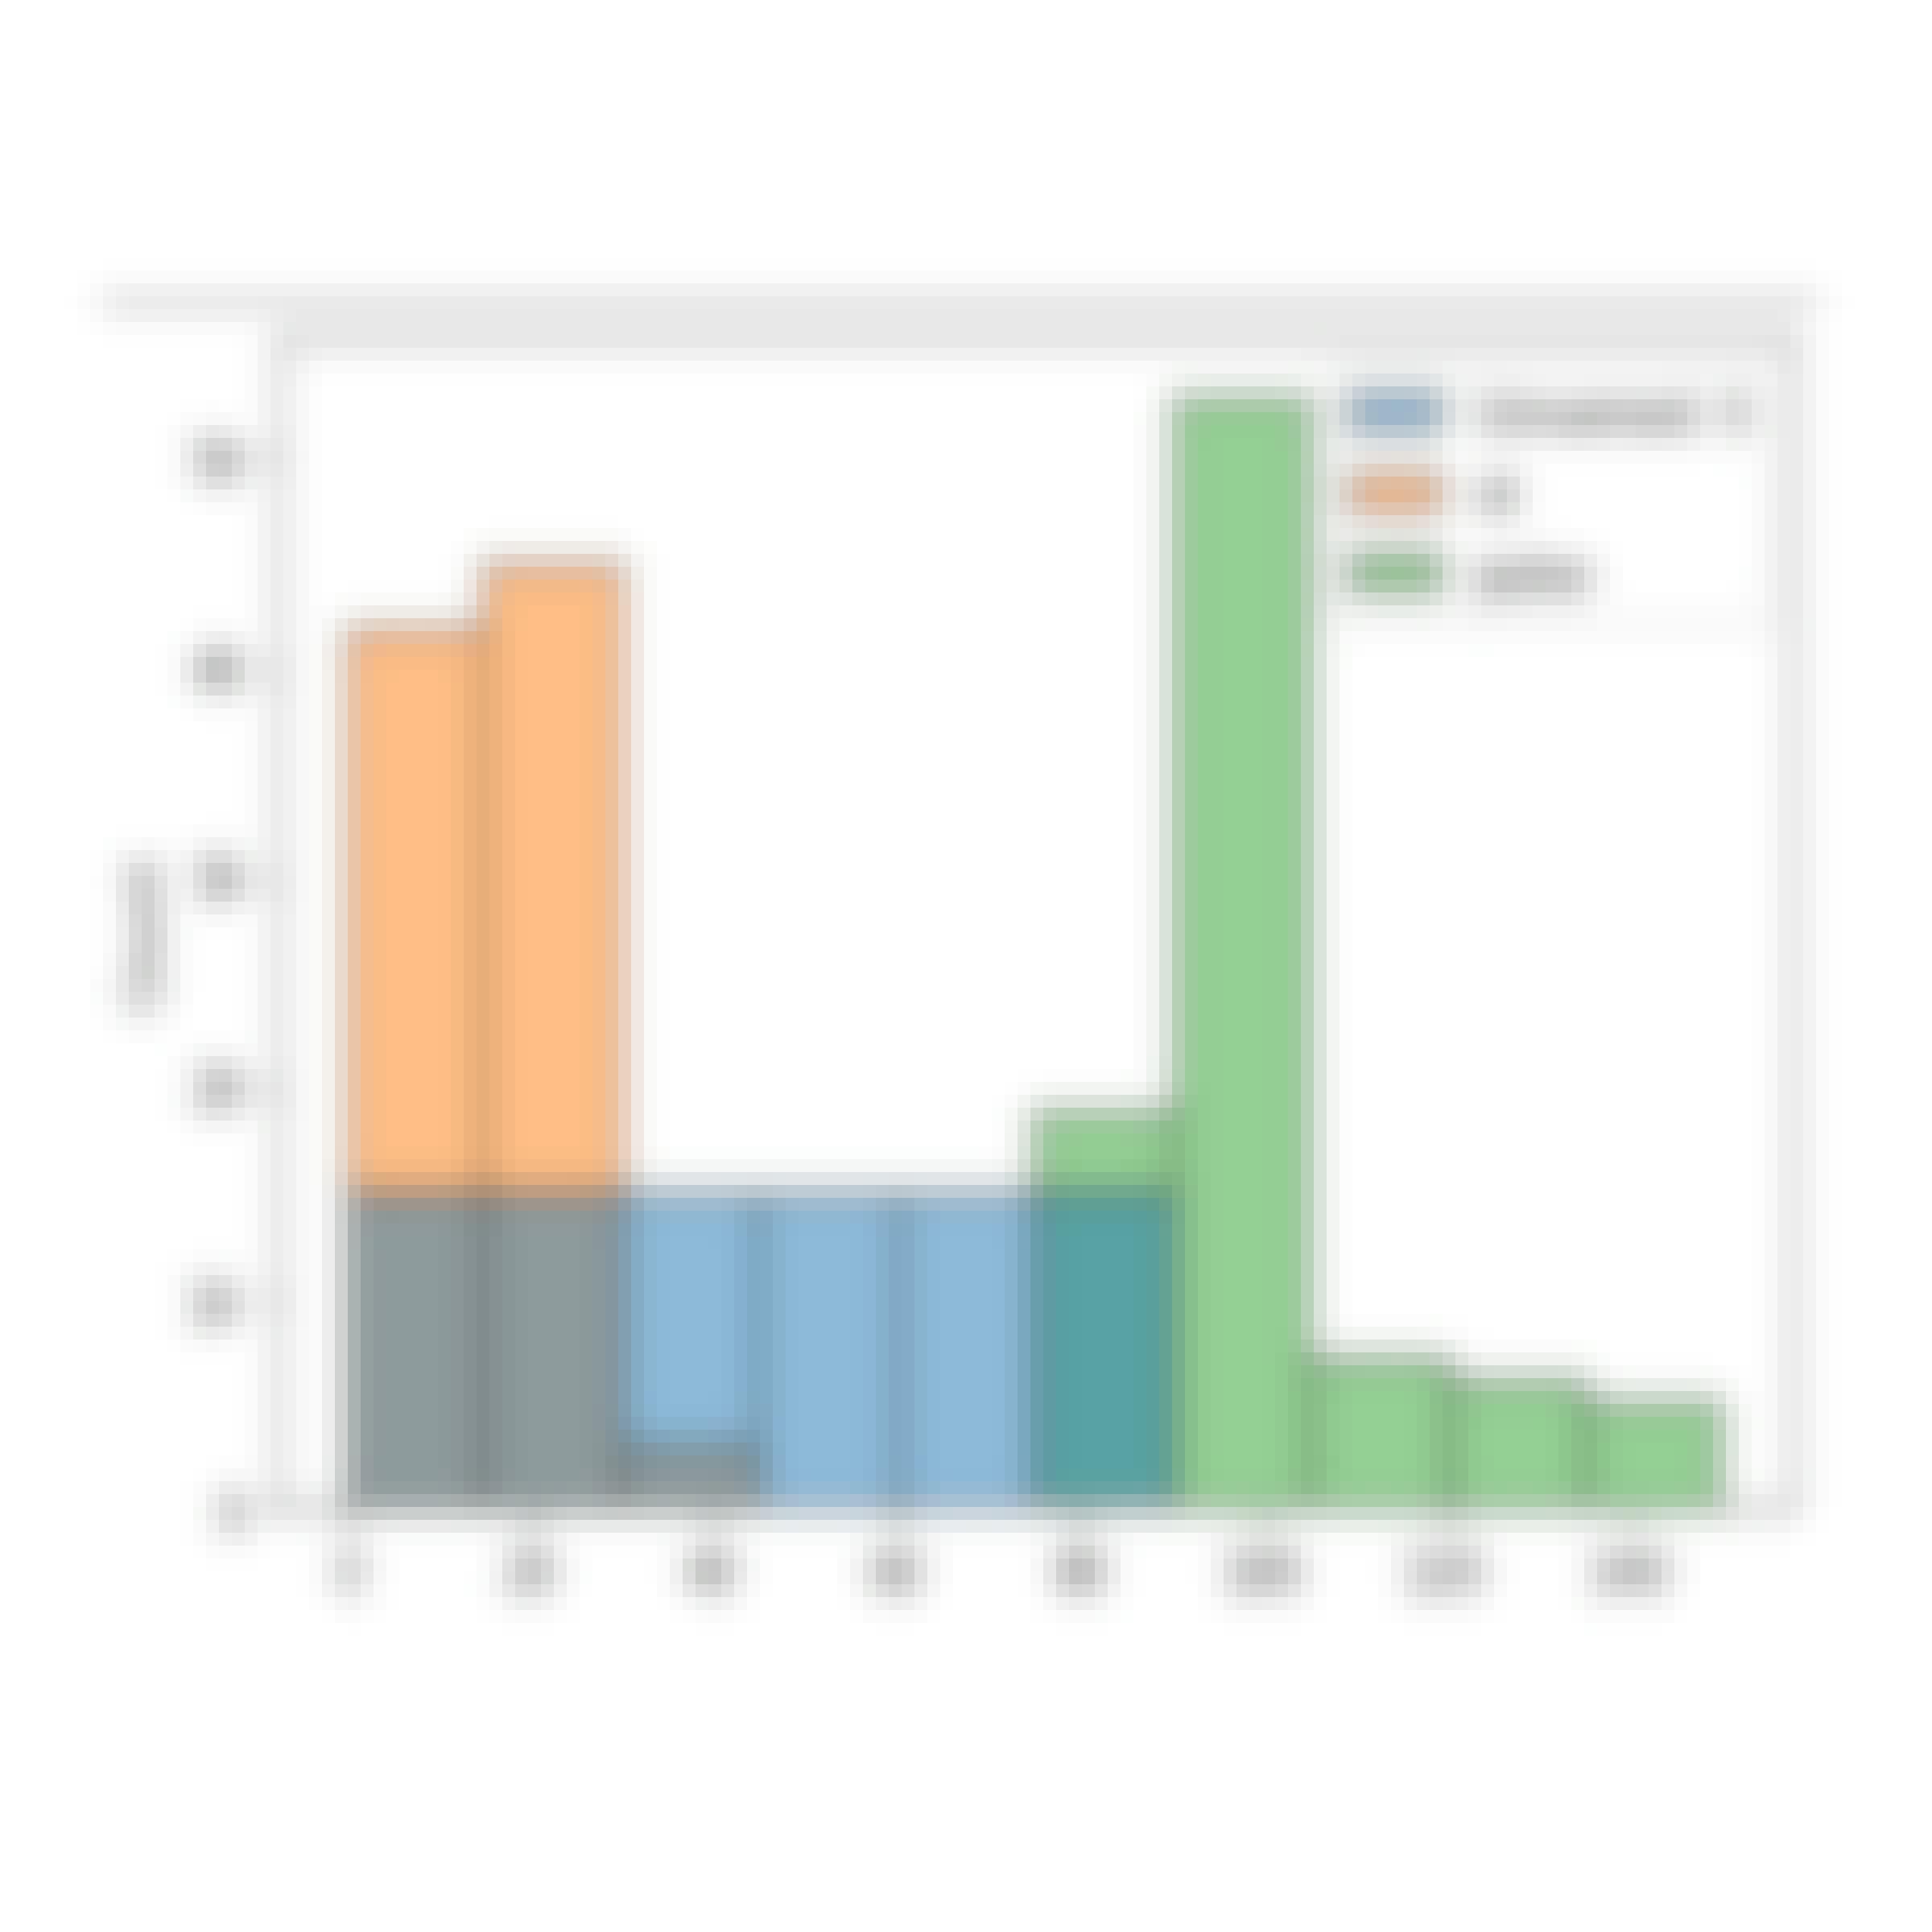
      Skills you'll gain: Matplotlib, Seaborn, Exploratory Data Analysis, Data Visualization, Pandas (Python Package), Plot (Graphics), Statistical Visualization, Data Visualization Software, Scatter Plots, Data Analysis, Box Plots, Python Programming

      Intermediate · Guided Project · Less Than 2 Hours

    • Status: Free
      Free
      D

      DeepLearning.AI

      AI Agentic Design Patterns with AutoGen

      Skills you'll gain: Generative AI Agents, Agentic systems, LLM Application, Generative AI, Large Language Modeling, Artificial Intelligence, Tool Calling, Prompt Engineering, Software Design Patterns

      4.5
      Rating, 4.5 out of 5 stars
      ·
      35 reviews

      Beginner · Project · Less Than 2 Hours

    • Status: New
      New
      Status: Preview
      Preview
      P

      Pontificia Universidad Católica de Chile

      Análisis de sistemas térmicos usando Python

      Skills you'll gain: Thermal Management, Plot (Graphics), Mechanical Engineering, Engineering Analysis, HVAC, Scientific Visualization, Simulations, Engineering Calculations, Hydraulics, Numerical Analysis, Python Programming, NumPy

      Intermediate · Course · 1 - 3 Months

    • C

      Coursera Project Network

      Deep Learning with PyTorch : Object Localization

      Skills you'll gain: PyTorch (Machine Learning Library), Image Analysis, Computer Vision, Applied Machine Learning, Deep Learning

      4.6
      Rating, 4.6 out of 5 stars
      ·
      47 reviews

      Intermediate · Guided Project · Less Than 2 Hours

    • Status: Free Trial
      Free Trial
      U

      University of Colorado Boulder

      Statistics and Data Analysis with R

      Skills you'll gain: Descriptive Statistics, Statistical Hypothesis Testing, Regression Analysis, Probability Distribution, Statistical Analysis, R Programming, Data Import/Export, Statistical Modeling, Statistical Methods, Plot (Graphics), Statistics, Data Manipulation, Data Analysis, Statistical Inference, Data Structures

      4.8
      Rating, 4.8 out of 5 stars
      ·
      6 reviews

      Intermediate · Course · 1 - 3 Months

    1…91011…17

    In summary, here are 10 of our most popular plot (grafiken) courses

    • Random Models, Nested and Split-plot Designs: Arizona State University
    • How to Visualize Data with R: Packt
    • Fundamentals of Machine Learning for Supply Chain: LearnQuest
    • Simulation of Call Centre Operations Using R Simmer: Coursera Project Network
    • Introduction to Python for Scientific Computing: University of Colorado Boulder
    • Frozen in the Ice: Exploring the Arctic: University of Colorado Boulder
    • Simulation of Covid-19 Testing Process Using R Simmer: Coursera Project Network
    • Conducting Exploratory Data Analysis: Coursera Project Network
    • AI Agentic Design Patterns with AutoGen: DeepLearning.AI
    • Análisis de sistemas térmicos usando Python: Pontificia Universidad Católica de Chile

    Other topics to explore

    Arts and Humanities
    338 courses
    Business
    1095 courses
    Computer Science
    668 courses
    Data Science
    425 courses
    Information Technology
    145 courses
    Health
    471 courses
    Math and Logic
    70 courses
    Personal Development
    137 courses
    Physical Science and Engineering
    413 courses
    Social Sciences
    401 courses
    Language Learning
    150 courses

    Coursera Footer

    Technical Skills

    • ChatGPT
    • Coding
    • Computer Science
    • Cybersecurity
    • DevOps
    • Ethical Hacking
    • Generative AI
    • Java Programming
    • Python
    • Web Development

    Analytical Skills

    • Artificial Intelligence
    • Big Data
    • Business Analysis
    • Data Analytics
    • Data Science
    • Financial Modeling
    • Machine Learning
    • Microsoft Excel
    • Microsoft Power BI
    • SQL

    Business Skills

    • Accounting
    • Digital Marketing
    • E-commerce
    • Finance
    • Google
    • Graphic Design
    • IBM
    • Marketing
    • Project Management
    • Social Media Marketing

    Career Resources

    • Essential IT Certifications
    • High-Income Skills to Learn
    • How to Get a PMP Certification
    • How to Learn Artificial Intelligence
    • Popular Cybersecurity Certifications
    • Popular Data Analytics Certifications
    • What Does a Data Analyst Do?
    • Career Development Resources
    • Career Aptitude Test
    • Share your Coursera Learning Story

    Coursera

    • About
    • What We Offer
    • Leadership
    • Careers
    • Catalog
    • Coursera Plus
    • Professional Certificates
    • MasterTrack® Certificates
    • Degrees
    • For Enterprise
    • For Government
    • For Campus
    • Become a Partner
    • Social Impact
    • Free Courses
    • ECTS Credit Recommendations

    Community

    • Learners
    • Partners
    • Beta Testers
    • Blog
    • The Coursera Podcast
    • Tech Blog

    More

    • Press
    • Investors
    • Terms
    • Privacy
    • Help
    • Accessibility
    • Contact
    • Articles
    • Directory
    • Affiliates
    • Modern Slavery Statement
    • Manage Cookie Preferences
    Learn Anywhere
    Download on the App Store
    Get it on Google Play
    Logo of Certified B Corporation
    © 2025 Coursera Inc. All rights reserved.
    • Coursera Facebook
    • Coursera Linkedin
    • Coursera Twitter
    • Coursera YouTube
    • Coursera Instagram
    • Coursera TikTok