
Filter by
SubjectRequired
LanguageRequired
The language used throughout the course, in both instruction and assessments.
Learning ProductRequired
LevelRequired
DurationRequired
SkillsRequired
SubtitlesRequired
EducatorRequired
Results for "pivot tables and charts"
 Status: Free
Coursera Project Network
Skills you'll gain: Dashboard, Data Visualization, Interactive Data Visualization, Data Presentation, Tableau Software, Data Visualization Software, Exploratory Data Analysis, Business Intelligence, Data Analysis
 Status: Free Trial
University of Pennsylvania
Skills you'll gain: Data Storytelling, Data Presentation, Data Visualization Software, Data Visualization, Tableau Software, Presentations, Verbal Communication Skills, Data-Driven Decision-Making, Data Analysis, Scatter Plots, Stakeholder Communications, Spatial Analysis, Trend Analysis
 Status: Free Trial
University of Colorado Boulder
Skills you'll gain: Matplotlib, Statistical Visualization, Seaborn, Data Visualization, Exploratory Data Analysis, Data Presentation, Plot (Graphics), Data Visualization Software, Descriptive Statistics, Data Storytelling, Pandas (Python Package), Statistical Methods, Data Analysis, Statistics, Statistical Analysis, Data Manipulation, Box Plots, Scatter Plots, Correlation Analysis, Python Programming
Coursera Project Network
Skills you'll gain: Data Visualization, Data Visualization Software, Data Presentation, Interactive Data Visualization, Data Literacy, Visualization (Computer Graphics), Javascript, Data Analysis, Microsoft Visual Studio
Coursera Project Network
Skills you'll gain: Hypertext Markup Language (HTML), HTML and CSS, Cascading Style Sheets (CSS), Web Design, Interactive Design, Color Theory, User Interface (UI), Web Development
 Status: Free Trial
Skills you'll gain: Musical Composition, Music Theory, Music, Music Performance, Creativity

Coursera Project Network
Skills you'll gain: Hypertext Markup Language (HTML), Cascading Style Sheets (CSS), Responsive Web Design, Browser Compatibility, Web Development
Coursera Project Network
Skills you'll gain: Microsoft Excel, Spreadsheet Software, Data Integration, Excel Formulas, Data Import/Export

Coursera Project Network
Skills you'll gain: Hypertext Markup Language (HTML), Web Development, Web Applications, Web Design and Development, Web Development Tools, Web Design, Web Content
 Status: Free Trial
LearnQuest
Skills you'll gain: JSON, Apple iOS, Mobile Development, Application Programming Interface (API), Swift Programming, Data Storage, Model View Controller, Data Modeling, Data Storage Technologies, UI Components, Network Protocols
Coursera Project Network
Skills you'll gain: Statistical Process Controls, Six Sigma Methodology, Quality Control, Plot (Graphics), Data Literacy, Statistical Analysis, R Programming
 Status: NewStatus: Free Trial
EDUCBA
Skills you'll gain: Hypertext Markup Language (HTML), Web Content Accessibility Guidelines, Semantic Web, Interactive Design, Usability, Web Design, Information Architecture
In summary, here are 10 of our most popular pivot tables and charts courses
- Dynamic Dashboards with Tableau: Advanced Sales Analysis: Coursera Project Network
- Data Viz Using Tableau & Presenting With Storytelling: University of Pennsylvania
- Data Understanding and Visualization: University of Colorado Boulder
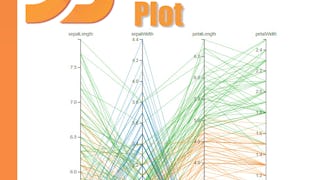
- Simple Parallel Coordinates Plot using d3 js: Coursera Project Network
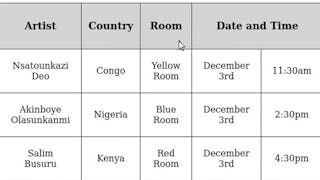
- HTML for Beginners: Tables and Forms: Coursera Project Network
- Musicianship: Chord Charts, Diatonic Chords, and Minor Keys: Berklee
- Style Tables with CSS: Coursera Project Network
- Interweaving Tables, References, and Links in Excel: Coursera Project Network
- Tables and Forms in HTML: Coursera Project Network
- Tables, Data & Networking in iOS: LearnQuest


